Guide
Manufacturing Application (Aplikasi Manufaktur): From Bill of Material to Shopfloor
A good manufacturing application (aplikasi manufaktur in Indonesian) makes the bill of material (BOM) in the office and the operator’s report on the floor describe the same thing. If the BOM is tidy but operators still write on paper, you hold a recipe without knowing what was actually cooked.
At Synetica, we judge an application by one journey: BOM, work order, operator report, shift result, then the number a manager reads. The worked examples below are illustrative, not client results.
This guide covers the definition, a multi-level BOM explosion, one shift’s OEE, the modules that matter, buy versus custom, vendor checks, a cost model, and a staged rollout. For material planning and costing, read our manufacturing software guide alongside it.
TL;DR — the whole guide in five lines
- Explode one multi-level BOM: if the application cannot derive sub-assembly needs down to the screw, its BOM is a list, not a production model.
- Operators are the primary users: a report that takes three minutes per transaction gets filled in from memory at the end of the shift.
- Calculate OEE from records, not estimates: downtime, speed, and rejects must be captured per shift.
- Buy standard first, build the shopfloor gap: go custom only for data capture or process rules a package demonstrably cannot handle.
- Pilot one line for one order cycle: a wrong BOM and false stock hurt more than a missing feature.
How does a manufacturing application take a BOM to the shopfloor?
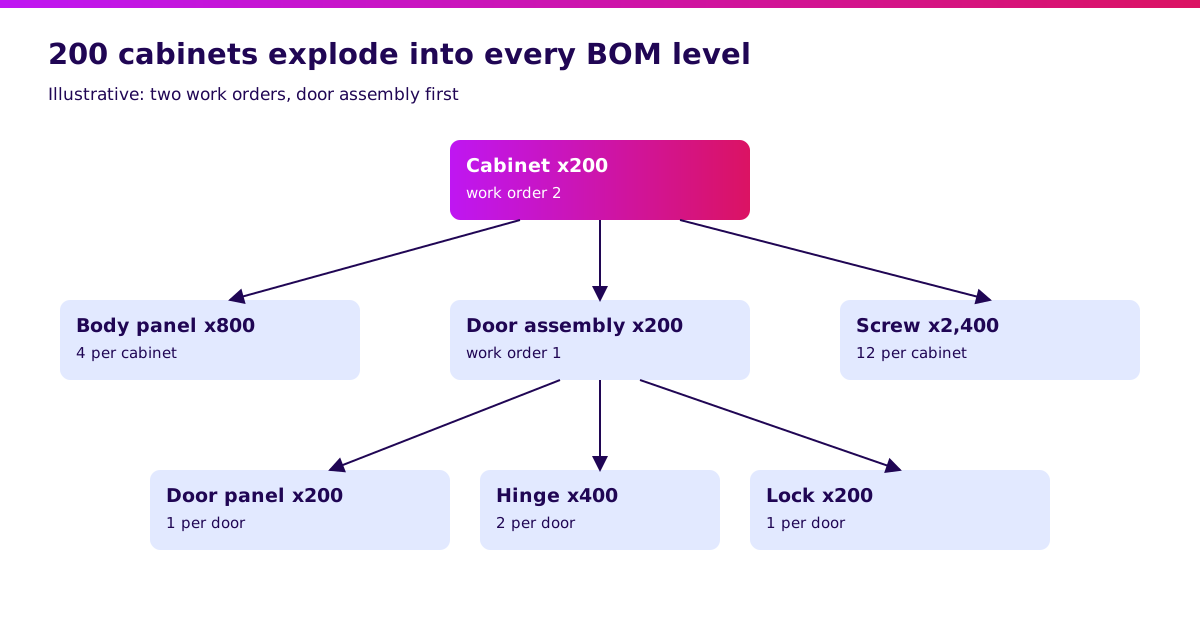
Explode one order through every BOM level before accepting a vendor demo. Hypothetical example: 200 steel cabinets. Every figure is illustrative.
One cabinet needs 4 body panels, 1 door assembly, and 12 screws. One door assembly needs 1 door panel, 2 hinges, and 1 lock.
| Level | Component | Needed per cabinet | For 200 cabinets |
|---|---|---|---|
| 0 | Finished cabinet | 1 | 200 |
| 1 | Body panel | 4 | 800 |
| 1 | Door assembly | 1 | 200 |
| 1 | Screw | 12 | 2,400 |
| 2 | Door panel (for the door assembly) | 1 | 200 |
| 2 | Hinge (for the door assembly) | 2 | 400 |
| 2 | Lock (for the door assembly) | 1 | 200 |
That means two work orders: one for the door assembly (200 units) and one for the cabinet (200 units) that consumes it. An application that knows only one level leaves planners counting hinges and locks by hand.
The test: swap one hinge for an approved substitute and see whether open work orders keep the old BOM while new orders use the new one. Map your BOM and work orders before choosing a system.
What is a manufacturing application?
A manufacturing application connects BOMs, routings, work orders, material stock, operator reports, and production results in one data flow. It may be an ERP manufacturing module, a standalone production app, or a capture layer over the systems you already run.
Think of a scoreboard filled in by the people playing. If the players cannot fill it quickly, the score gets invented.
- Hold multi-level BOMs and routings with an active version.
- Create and release work orders with their material needs.
- Accept output, scrap, and downtime reports straight from the floor.
- Update raw-material and finished-goods stock from each report.
- Show OEE, yield, and late orders to managers.
The difference from manufacturing software focused on MRP and costing: a manufacturing application is judged by the quality of data captured on the floor. If your real decision is a full suite, start with our ERP system build vs buy guide.
Manufacturing application: ready-made vs custom
Choose the smallest architecture that can repeat your BOM and shift-report tests. The budgets below are planning assumptions, not vendor price benchmarks. Durations are illustrative scopes excluding procurement.
| Option | Initial setup/build assumption | Pilot window | Flexibility | Best fit |
|---|---|---|---|---|
| Ready-made SaaS or ERP module | IDR 45m | 4–8 weeks | Standard BOM, work orders, and reports | Discrete production with conventional routings |
| Hybrid: standard core + custom capture layer | IDR 120m | 8–12 weeks | Custom operator screens and machine integrations | Planning works, data capture is unusual |
| Custom production workflow | IDR 280m | 12–16 weeks | Specific batch, yield, or routing rules | Proven process gap a package cannot model |
Initial cost excludes recurring licences and support. Custom here means workflows around a standard ledger and stock record, not rewriting accounting rules.
If an existing package passes the tests in this guide, configuring it is a good result.
Which manufacturing application features must you have?
Give every module an owner, an acceptance example, and a next action. The five modules below follow one pattern. The roles name who should validate each; they are not interviewed customers.
1. Multi-level BOM and routing — owned by engineering
This is the product model everyone else depends on.
What it helps you do
- Keep multi-level BOMs with one active version per effective date.
- Define approved substitute materials.
- Record routings: work centre, sequence, and standard rate.
- See where a component is used before changing or retiring it.
Walkthrough: change the door hinge type. Open orders keep the old BOM, new orders use the new one from a stated date, and the cost impact shows on both.
Why this design: engineering owns the structure because one uncontrolled BOM edit changes every plan that uses it.
Use your own BOM as the prototype brief.
2. Work orders — owned by production planning
This is a trackable instruction, not just a number.
What it helps you do
- Release work orders with material and routing attached.
- Separate sub-assembly work orders from finished-product work orders.
- Flag orders that are already late before release.
- Reprioritise without retyping the order.
Walkthrough: release a 200-unit door-assembly order and a 200-unit cabinet order. The cabinet must not start before the doors are available, and the system says why.
Why this design: planners need to see why an order is held; a bare “pending” status sends people back to WhatsApp.
Check where stock and purchasing records meet.
3. Shopfloor reporting — owned by the plant manager
This is the module most likely to fail because it was designed for the office, not the line.
What it helps you do
- Report output, scrap, and rework by touch, barcode scan, or tablet.
- Record downtime with a reason code.
- Issue materials against the order, including backflush where suitable.
- Save reports through a connection drop and sync afterwards.
Walkthrough: an operator reports 171 good cabinets and 9 rejects out of 180. Stock falls according to the BOM, rejects are logged with a reason, and the shortfall stays visible instead of the order being quietly closed.
Why this design: reporting must be faster than writing on paper. Otherwise the data is filled in from memory at the end of the shift.
Define reporting steps before production development.
4. Quality and traceability — owned by quality
This is the paper trail you wish you had when a customer calls.
What it helps you do
- Record inspections against batch, order, and work centre.
- Quarantine a failed batch so it cannot be issued.
- Trace a finished lot back to material batches and forward to customers.
- Hold corrective-action notes against the cause.
Walkthrough: mark one hinge batch as failed. Every open order that would consume it is blocked, and a report lists finished lots that already used it.
Why this design: a production system that can still ship a quarantined batch is worse than none.
5. OEE and production dashboard — owned by management
These are the numbers read each morning, and they must come from records.
What it helps you do
- Calculate availability, performance, and quality by line and shift.
- Show the largest downtime causes by reason code.
- Compare planned and actual output per work order.
- Drill from a figure to the operator reports behind it.
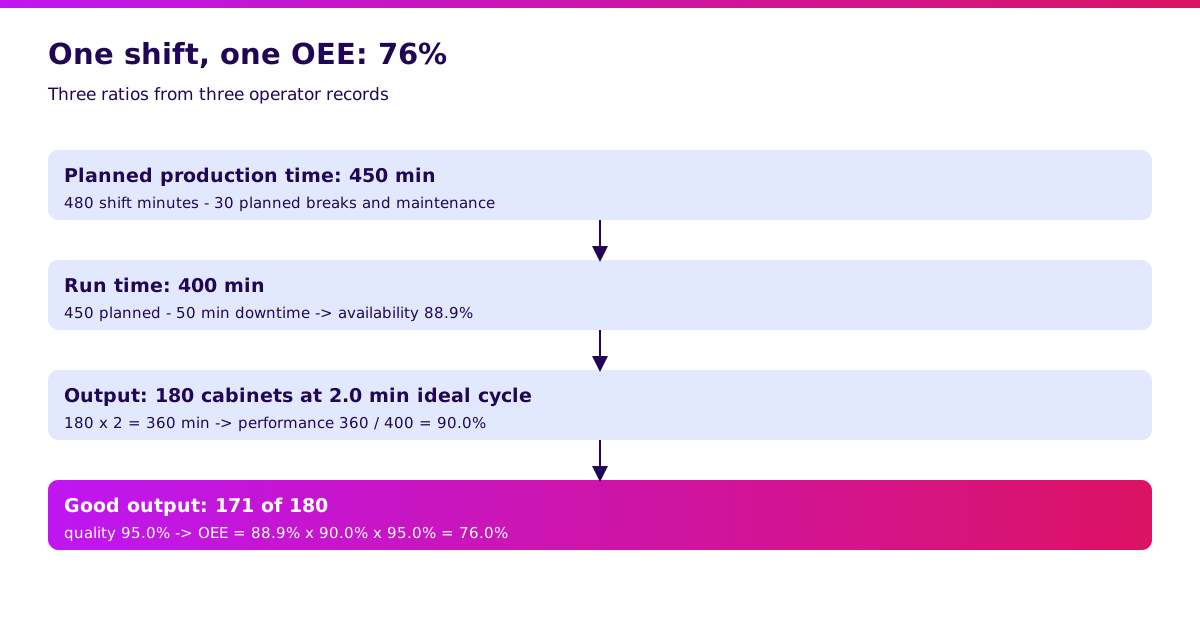
Walkthrough: an 8-hour shift, 30 planned minutes of breaks, 50 minutes of downtime, 180 cabinets at an ideal 2-minute cycle, 171 good. OEE = 342 ÷ 450 = 76%.
Why this design: OEE with no trail to operator reports only starts a meeting about the number.
“I would run one real shift from BOM to OEE report before signing off the scope.” — Ganis Atmawarin, editorial recommendation for this guide.
How do operator reports become trustworthy OEE?
OEE is just three ratios from three records. If one record is missing, the number cannot be trusted.
In the shift above: 480 minutes of shift time, 30 minutes of planned breaks and maintenance, so 450 minutes of planned production time. 50 minutes of downtime leaves 400 minutes of run time.
| Component | Calculation | Result |
|---|---|---|
| Availability | 400 ÷ 450 | 88.9% |
| Performance | (180 × 2 min) ÷ 400 | 90.0% |
| Quality | 171 ÷ 180 | 95.0% |
| OEE | 88.9% × 90.0% × 95.0% | 76.0% |
A quick check: 171 good cabinets × 2 minutes = 342 productive minutes out of 450 planned = 76%.
Write a freshness agreement: downtime logged with a reason before the shift ends, scrap reported before the order closes, and the dashboard available before the next shift starts. These are proposed business requirements, not promises about any vendor.
Never accept a dashboard that shows 100% availability simply because no downtime was recorded.
Validate it in 2 weeks. Synetica’s Blueprint & Prototype maps one production decision, tests the workflow with planners and operators, and defines integration scope before a larger build commitment.
When is off-the-shelf enough, and when do you need custom?
Buy when standard flows fit; consider custom when a measurable gap survives a realistic pilot. Discrete production with stable routings and conventional BOMs usually favours configuration.
Hybrid becomes useful when planning works but data capture does not: machines with their own counters, scales, unusual barcode steps, or a legacy system that must stay for now. Start with a capture layer that only sends data to the core system.
Custom can make sense when the process itself is the competitive advantage: variable yields, co-products, regulated batch records, or routing logic no package models. Measure handling time and error frequency first.
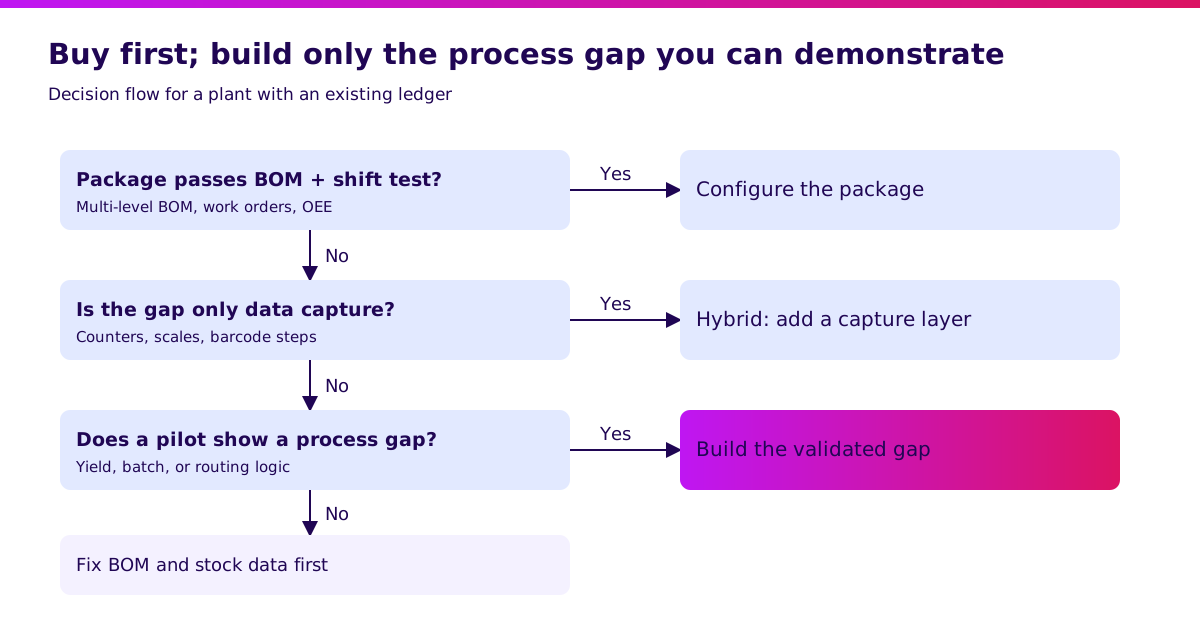
If the real problem is an inaccurate BOM or unreliable stock, a new application inherits it. Fix the master data first, then judge the tool.
Discuss the smallest validated production scope after the pilot identifies the gap.
How do you choose a manufacturing application? A vendor checklist
Use your own BOMs and failure cases in the demo. Ask the vendor to demonstrate these ten checks and keep the evidence with your procurement decision.
- Explode the 200-cabinet BOM with your data and show the work order at each level.
- Change a component while orders are open without breaking them.
- Release a work order, report partial output, and show stock updating.
- Report scrap and rework with reasons and show the effect on yield.
- Log downtime with a reason code and show it in OEE.
- Quarantine a batch and show every order and finished lot it touches.
- Test permissions by role: planner, operator, quality, manager.
- Cut the shopfloor connection and show how reports sync afterwards.
- Export BOMs, routings, work orders, stock history, and audit trails in a usable format.
- Demonstrate backup recovery and name who supports a failed integration.
Record pass, fail, workaround, and extra cost for each. Reject a workaround that depends on one person’s spreadsheet.
For hosting, security, support, and exit terms, use our software vendor due diligence checklist.
How much does a manufacturing application cost in Indonesia?
Compare first-year total cost with a conservative, measurable benefit. The following hypothetical budget assumes one plant, 40 users, an existing accounting ledger, and limited integrations. It is not a quote or a market survey.
| First-year component, IDR millions | SaaS / ERP module | Hybrid | Custom |
|---|---|---|---|
| Configuration or build | 45 | 120 | 280 |
| Annual licences | 30 | 36 | 36 |
| BOM and master-data cleanup | 15 | 25 | 35 |
| Shopfloor devices and training | 20 | 30 | 40 |
| Support and monitoring | 10 | 24 | 48 |
| Contingency | 20 | 40 | 95 |
| First-year total | 140 | 275 | 534 |
Assume one line, 250 shifts a year, and OEE rising from 76% to 80%. Four points of a 450-minute shift is 18 productive minutes, or 9 cabinets at a 2-minute cycle. At a contribution margin of IDR 150,000 per cabinet: 9 × 250 × 150,000 = IDR 337.5m a year.
That only happens if there is demand for the extra 2,250 cabinets. It would cover the SaaS (140m) and hybrid (275m) budgets in this example, but not custom (534m). It is an assumption, not a promise.
Do not count freed hours as cash savings unless they are actually redeployed. Ask for a separate recurring-cost schedule covering licence growth, connector maintenance, and support. Then validate the business case with your own volumes.
How do you implement a manufacturing application in stages?
Expand after one production cycle where system and reality agree, with a rollback path. Your calendar depends on data quality, shift patterns, and sign-off capacity.
Start with two weeks of Blueprint & Prototype: name the decision owner, clean the BOM for one product family, map stock records, and test a prototype with planners and operators. Gate: the team agrees on the BOM and shift scenario and the acceptance evidence.
Next, configure the chosen package or build the validated gap. For a suitable custom scope, Synetica’s Production Grade Software phase is eight weeks after the two-week prototype phase; vendor setup timelines may differ.
Gate: BOM versions, operator reports, stock updates, and OEE match a manual calculation.
Run in parallel with the current process for one full order cycle. Require every difference to be explained, rollback to be rehearsed, and operators to report without end-of-shift backfilling.
Then add the next line or product family. Do not let a go-live date override unreconciled stock.
After release, review scrap, late orders, and user adoption. Launch & Grow is an ongoing monthly retainer for analytics and iteration where needed. Review the delivery approach.
What I would do before approving a manufacturing application
Bring one multi-level BOM, one real shift, and last month’s stock count to the first workshop. Those three records reveal more than a feature wishlist.
For Growing Businesses with an established plant, I would prioritise a trustworthy BOM and fast operator reporting before advanced scheduling. For a Dreamer starting a small workshop, a simple stock and order tool may be enough for now.
Start with the smallest useful decision and earn the next module.
Your next step: book a Blueprint & Prototype conversation with that shift’s data.
FAQ
What is a manufacturing application?
Software that connects BOMs, routings, work orders, stock, operator reports, and production results in one data flow. It can be a ready-made package or a layer over existing systems.
Which manufacturing application is best?
Choose the one that passes your BOM, work-order, and OEE tests with your own data. No package wins across every process, plant size, and integration need.
How much does a manufacturing application cost?
This guide models first-year budgets of IDR 140m for a SaaS or ERP module, IDR 275m for hybrid, and IDR 534m for custom. These are planning examples; get quotes against your scope.
Can a manufacturing application be custom-built?
Yes. Start with a validated process or integration gap and keep a standard ledger and stock record where possible. Include monitoring, audit history, and long-term ownership in the scope.
Manufacturing application or an off-the-shelf app: which is better?
Buy when standard BOMs, work orders, and reports fit your process. Build only the part that a realistic pilot shows the package cannot handle.
Related Posts
Two weeks to a real answer
Need help putting this into practice?
Book a Blueprint session and we'll turn the ideas in this article into a tested prototype in front of real users—2 weeks, from $3,000.